Busy days. Thin margins.
MARGE reads the numbers your food business already produces and puts margin leaks on the rail: what happened, why it was flagged, the evidence, and your options.
- Supplier priceBeef chuck (mince)+12.5% in 90 days1,455.95 MAD / monthMediumDemo data
- RefundsSaturday refunds2.6% of sales1,365.96 MAD / monthMediumDemo data
- Menu marginBurger RoyalFood cost 31.1% → 34.6%989.88 MAD / monthHighDemo data
- Identified this month3,266MAD / monthDemo restaurant only · overlaps counted once · an estimate, not a guaranteed saving
- ConsumptionMilkAbout 9% above recipesCafé counterMediumIllustrative
- Supplier priceButter+12% since springBakeryMediumIllustrative
Tickets from the MARGE demo restaurant, plus illustrative café and bakery examples
For restaurantscafés & coffee shopsbakeries & pastry shopsfast foodevery kitchen in between
Sales up. Profit down?
You see revenue, purchases and cash every day. What you rarely see is where the margin leaves: a little more per kilo on an invoice, a portion that grew, a refund nobody questioned. MARGE puts those numbers on paper.
Your month
What you see
- Sales
- Purchases
- Cash
What MARGE looks for
- Supplier price increaseson your own invoices
- Recipe cost driftdish by dish
- Menu prices left behindagainst your food-cost target
- Portions and consumptionabove what recipes explain
- Stock gapswhere counts are available
- Refunds and wastepatterns worth a look
- Orders that don’t follow usepurchasing anomalies
Margin, explained
From your numbers to your decision.
One path, six stations. Follow how MARGE turns ordinary business files into something you can act on, shown in the real app with the demo restaurant.
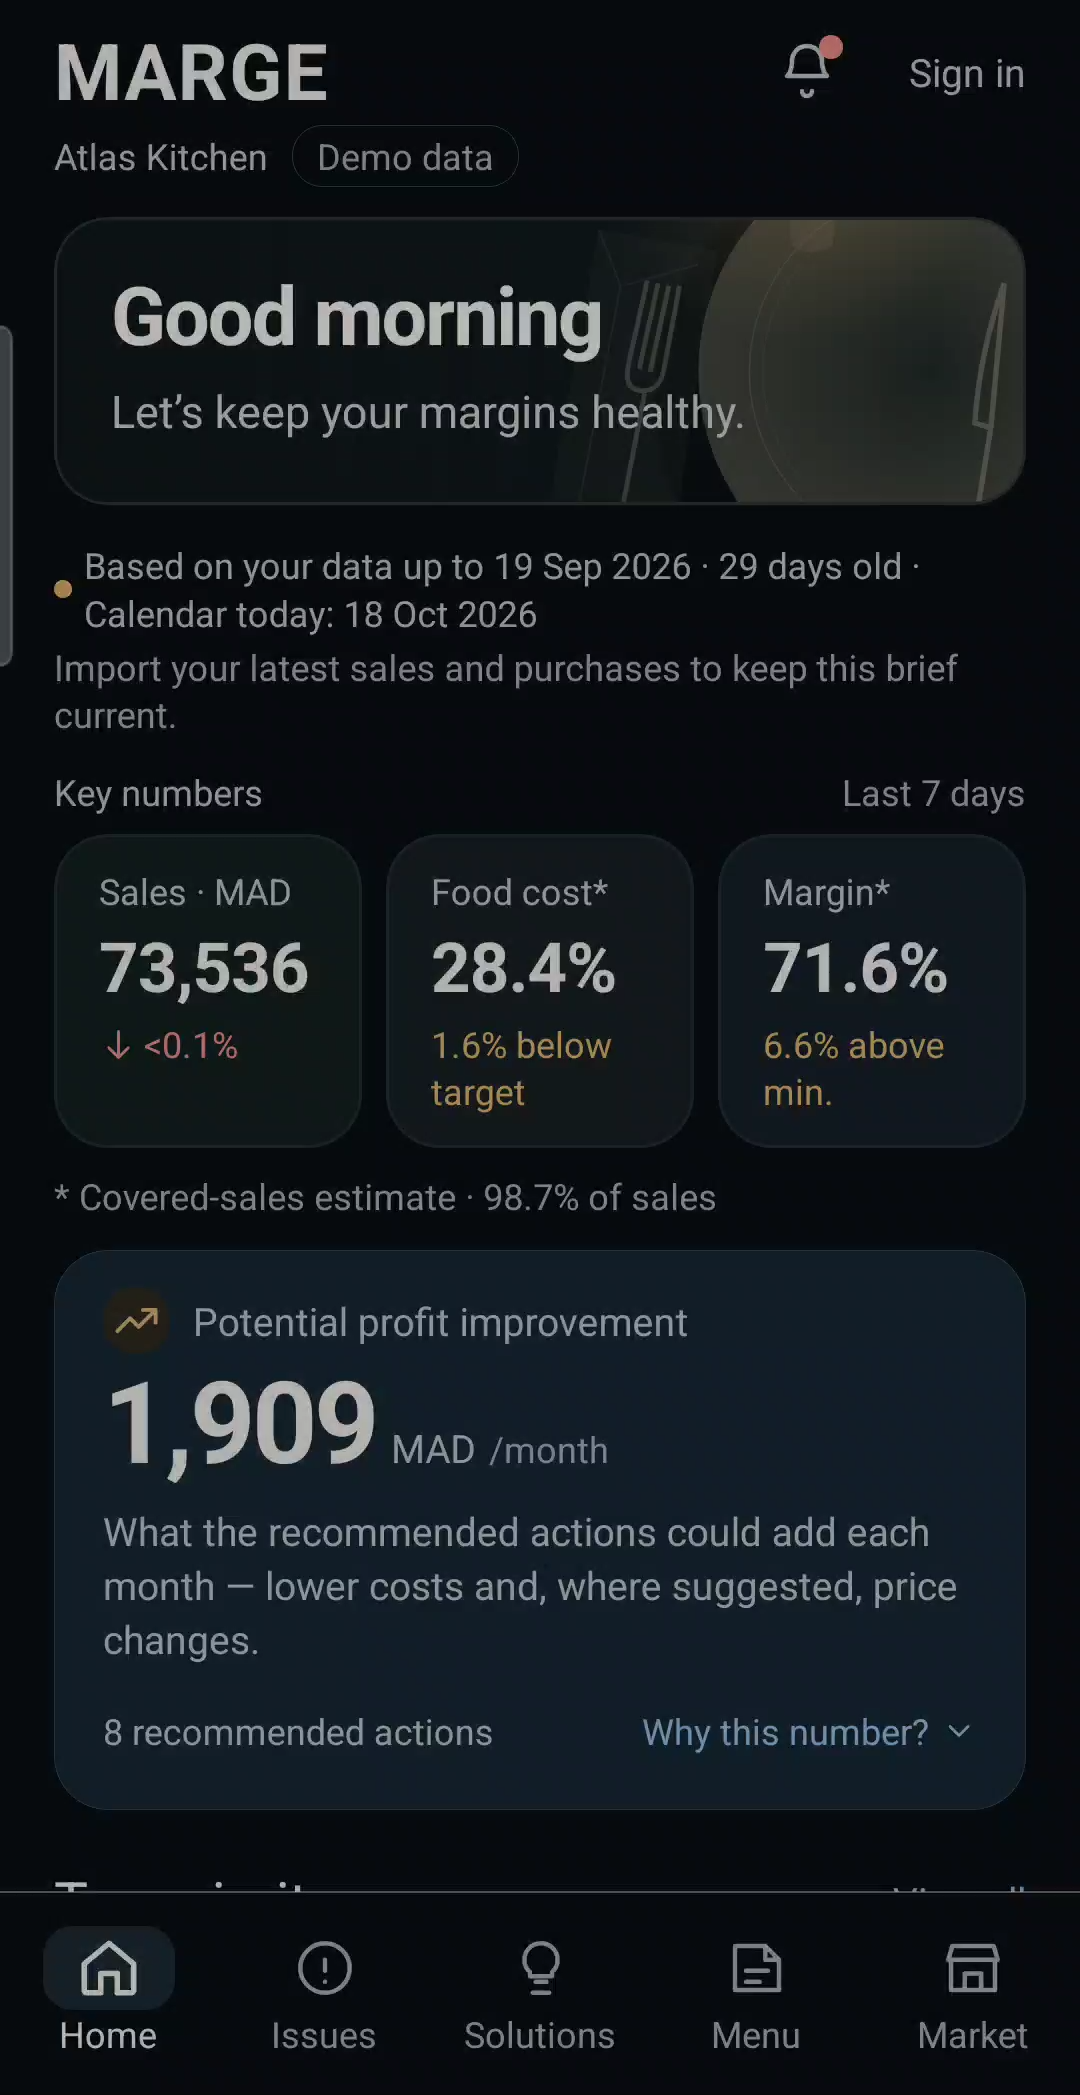
Real screens from the MARGE app, recorded with the demo restaurant. Amounts are demonstration data in MAD.
Your numbers
Business data comes in.
Sales, purchase invoices, recipes and stock counts: the files you already have. MARGE reads them together, so a price on an invoice can be traced to a dish on your menu.
Sales · Purchases · Recipes · Stock
A problem
A problem is identified.
Issues are ranked by what they may cost each month, the most expensive first. Overlapping effects are counted once, so the total doesn’t inflate.
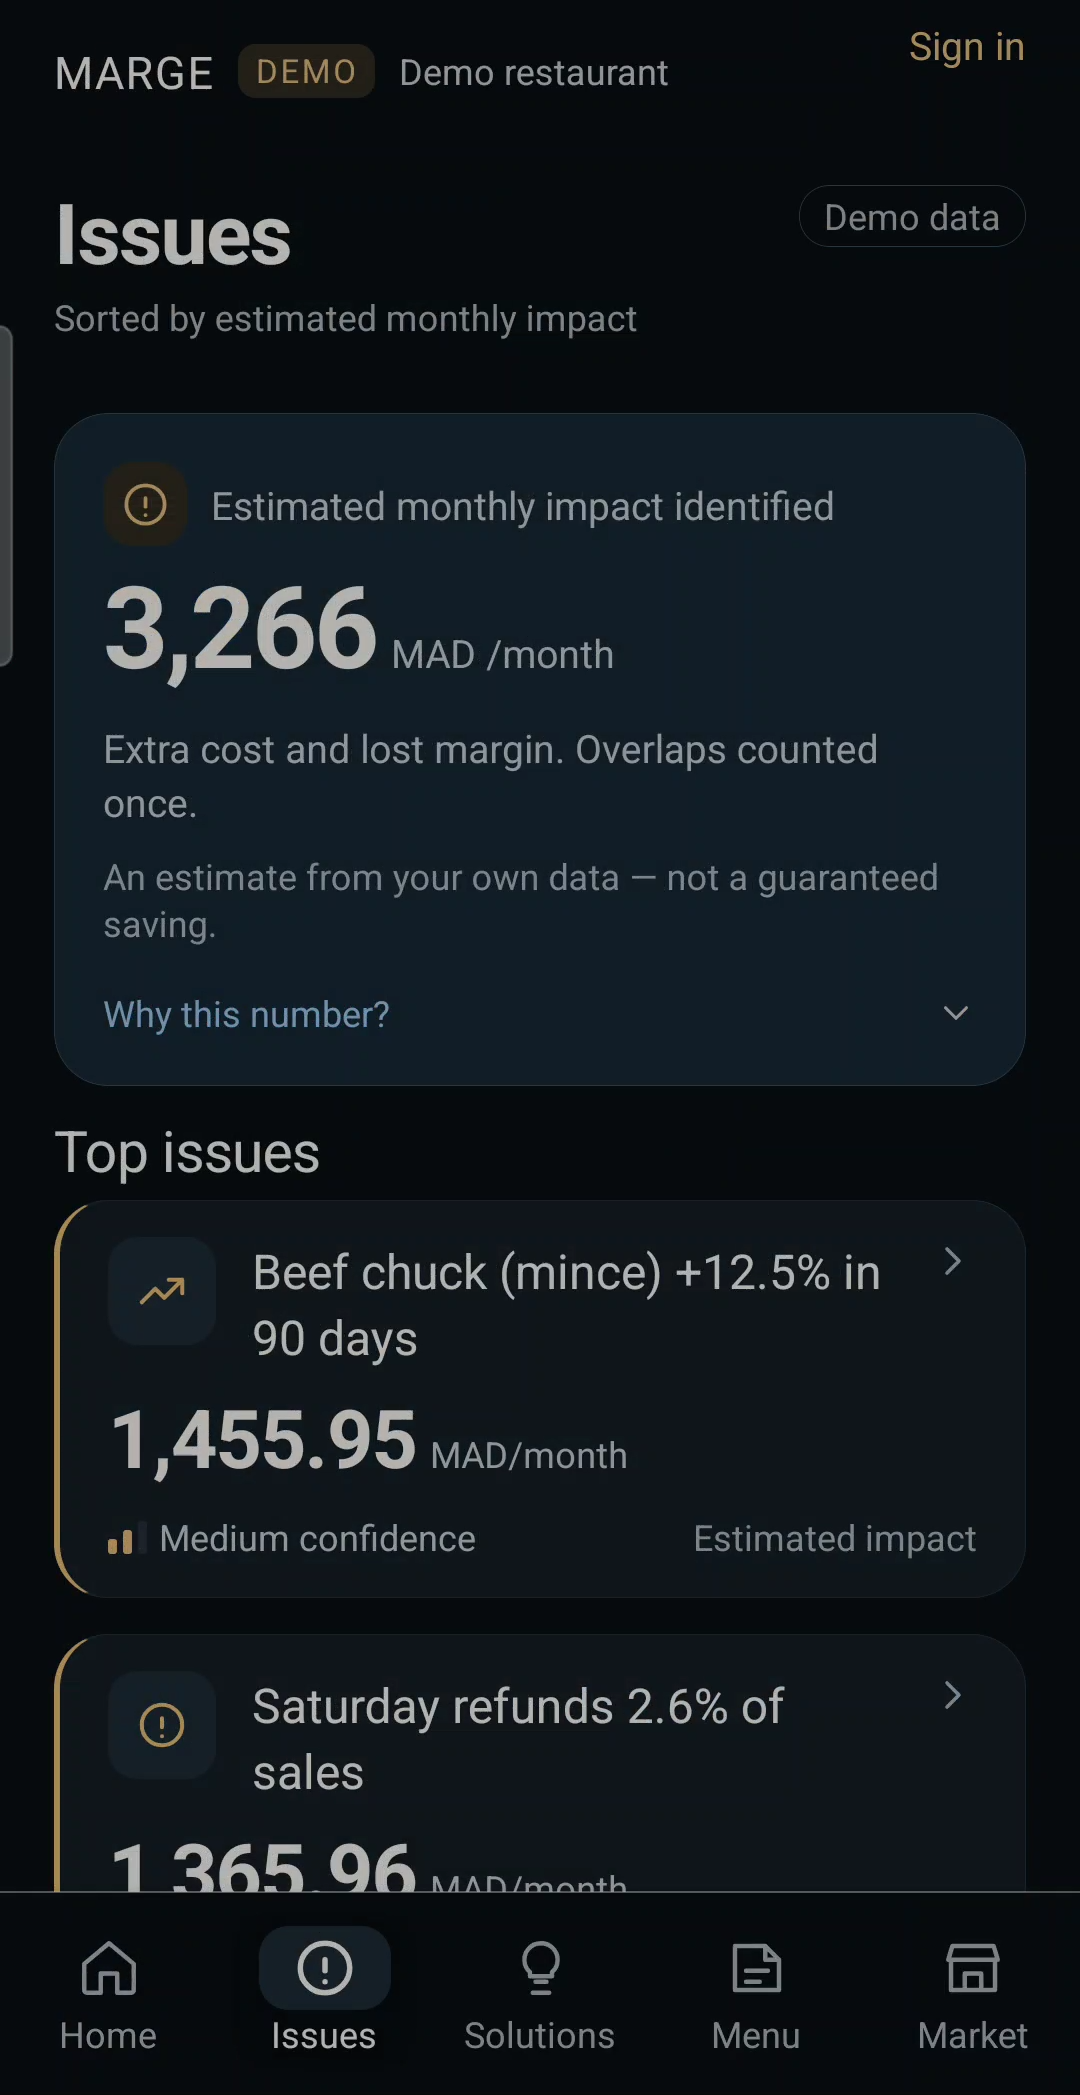
Ranked by monthly impact
The reason
The reason becomes clear.
Every issue says what changed, by how much and why it was flagged. For example: an ingredient price rising past the alert threshold the owner set.
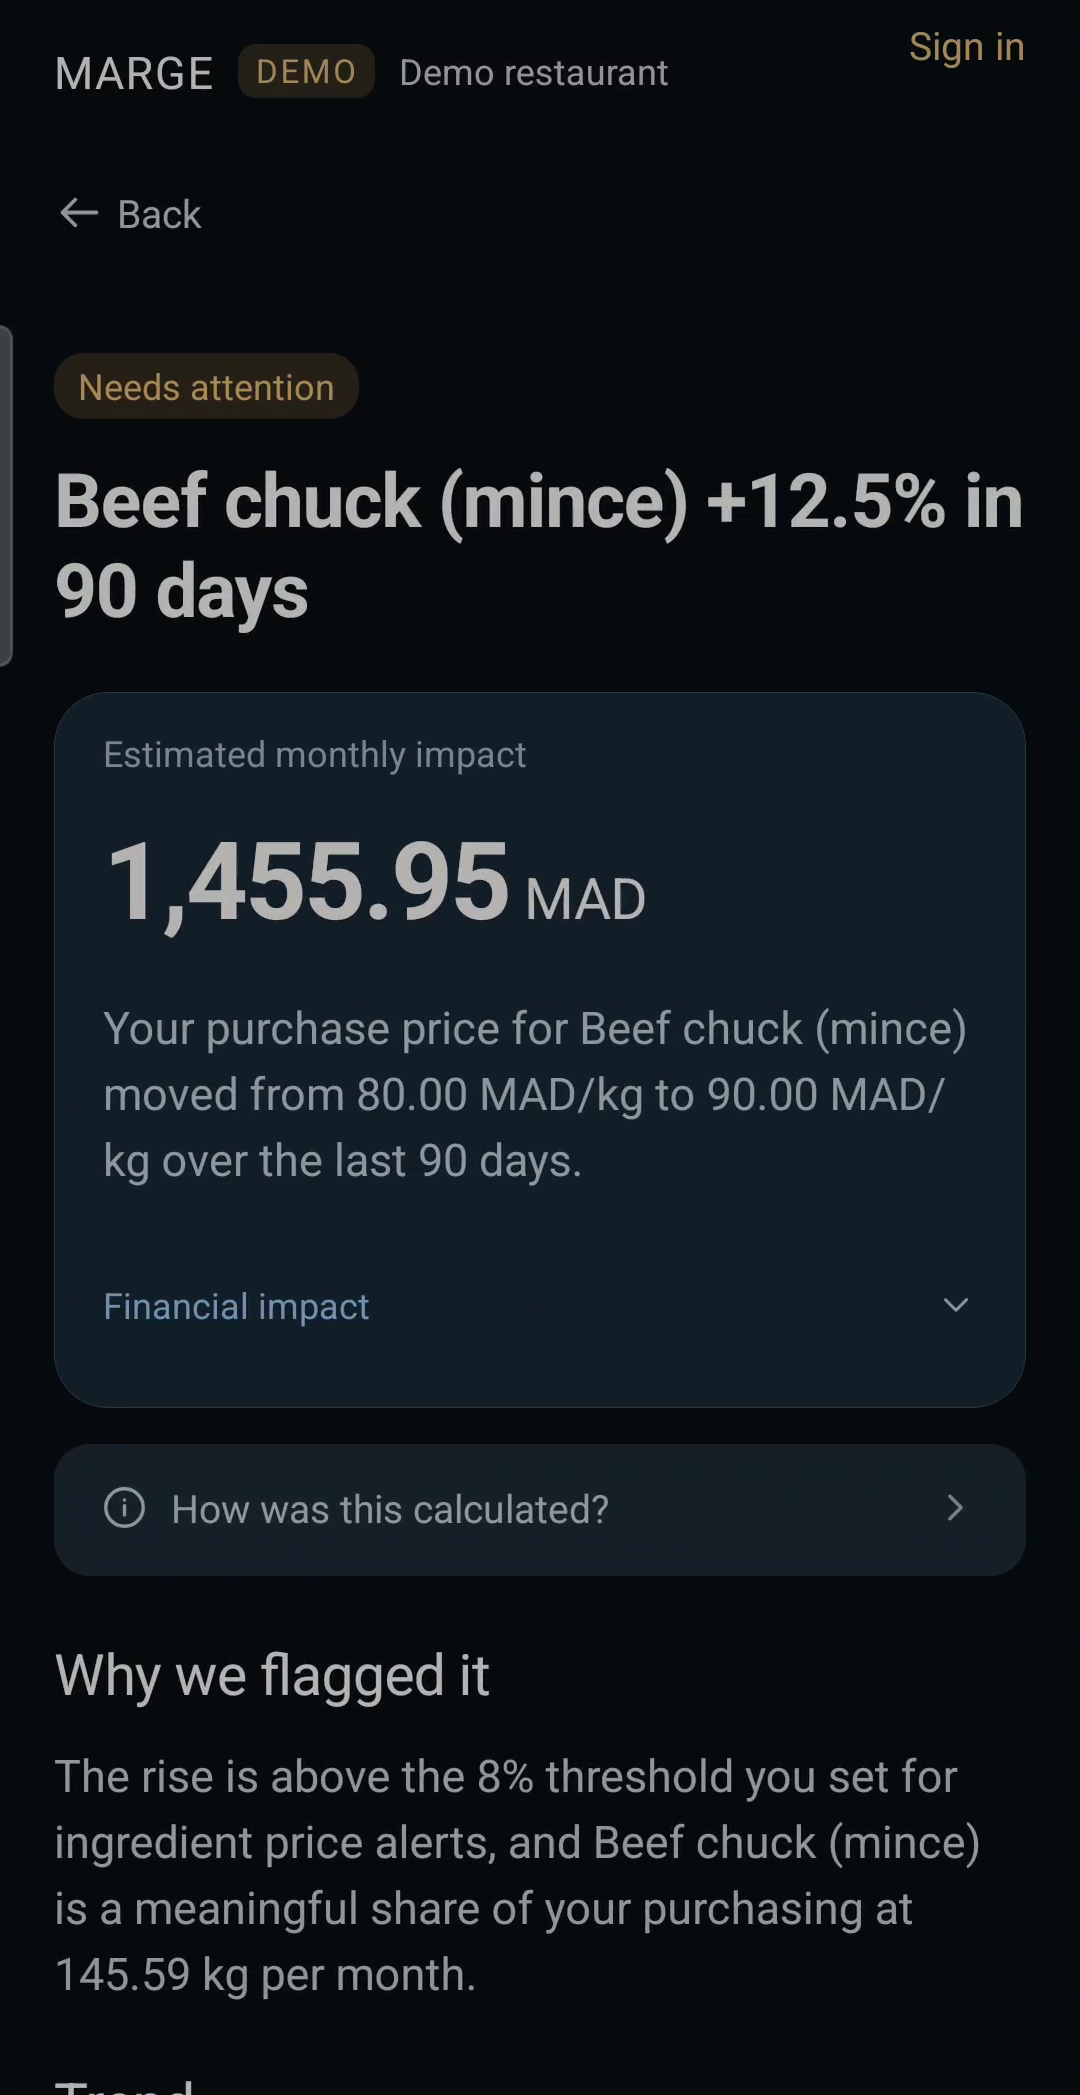
Why it was flagged
The evidence
The evidence is on the table.
Prices then and now, volumes, selling prices, the dishes affected, and a confidence level that reflects how complete the data is. No black box.
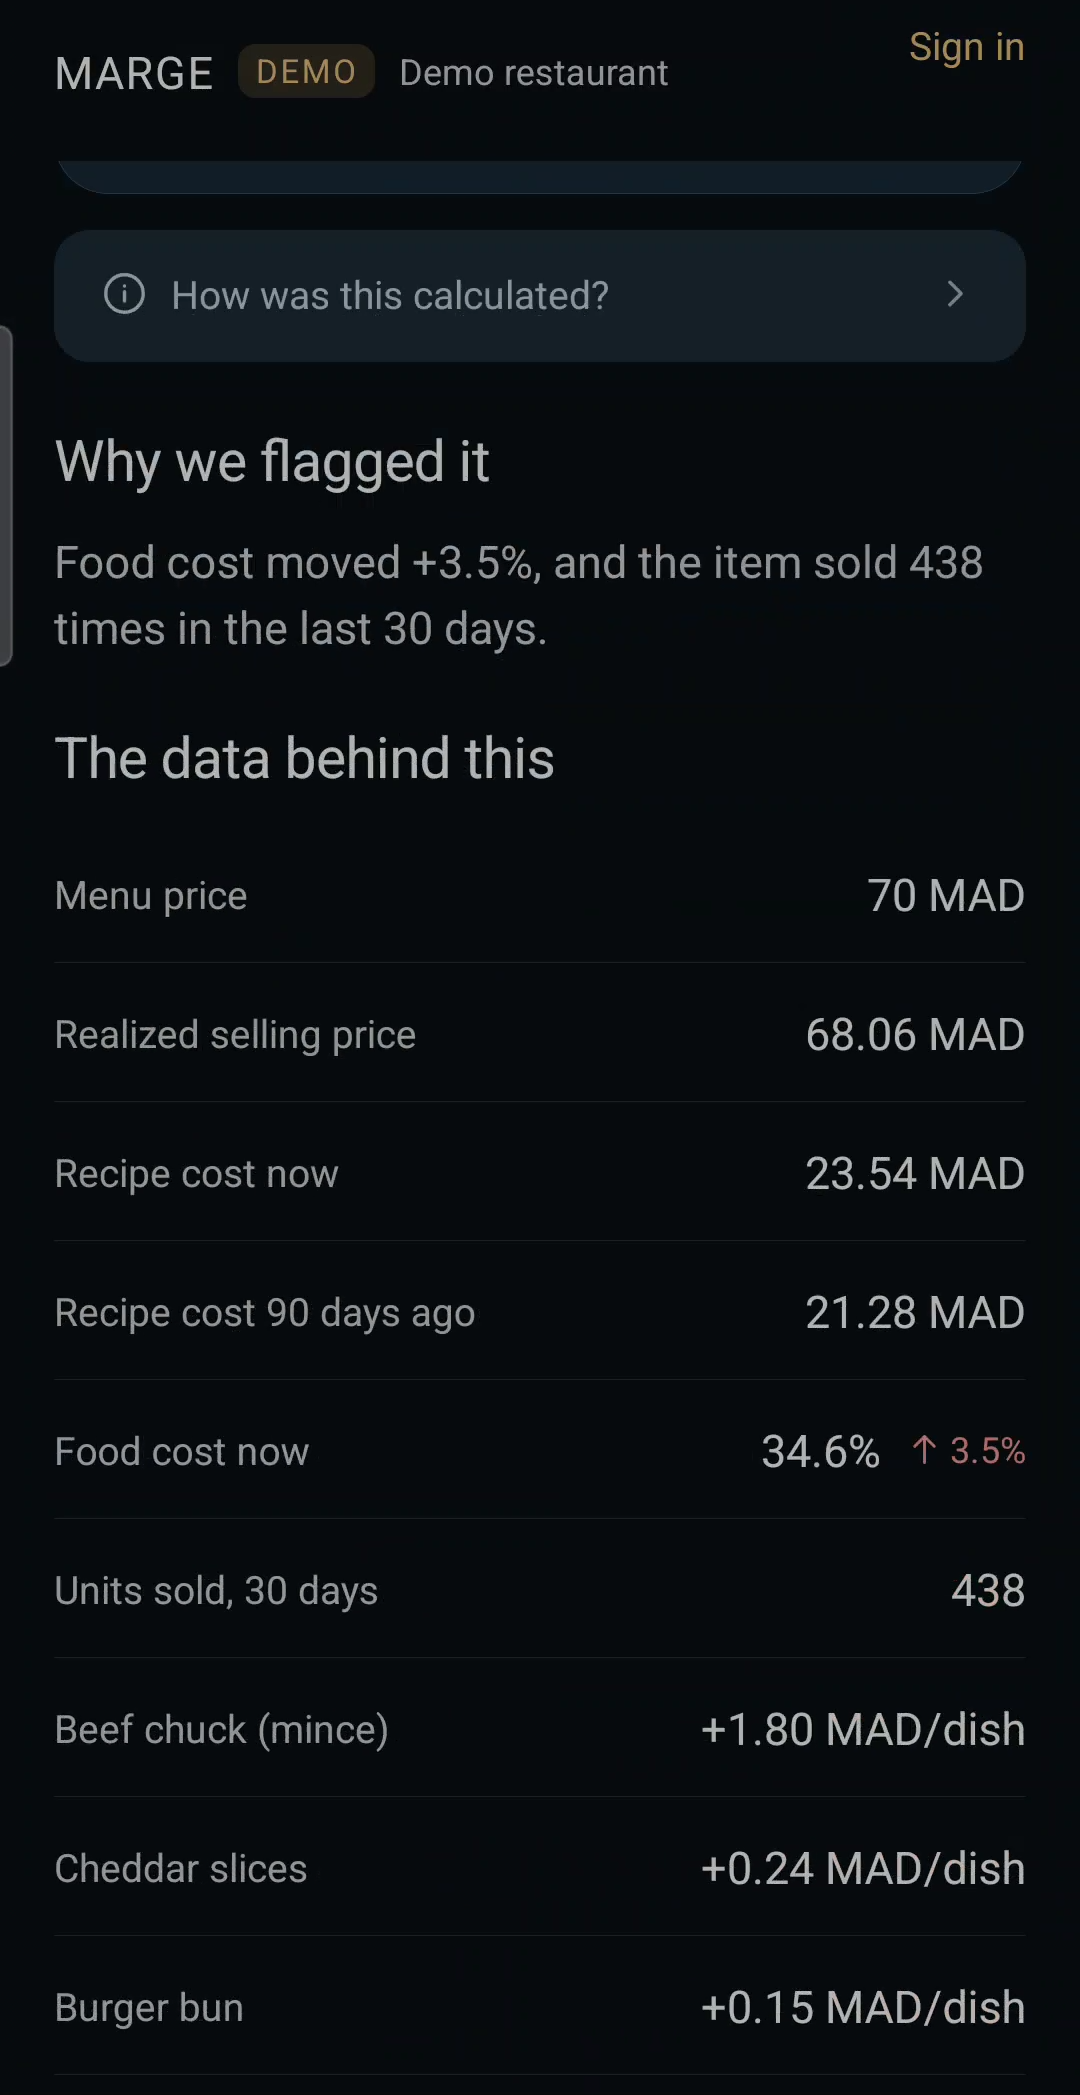
The data behind it
Possible actions
MARGE suggests possible actions.
Restore a food-cost target, reset a purchase price, review a portion. Each option shows its estimated monthly effect and confidence.
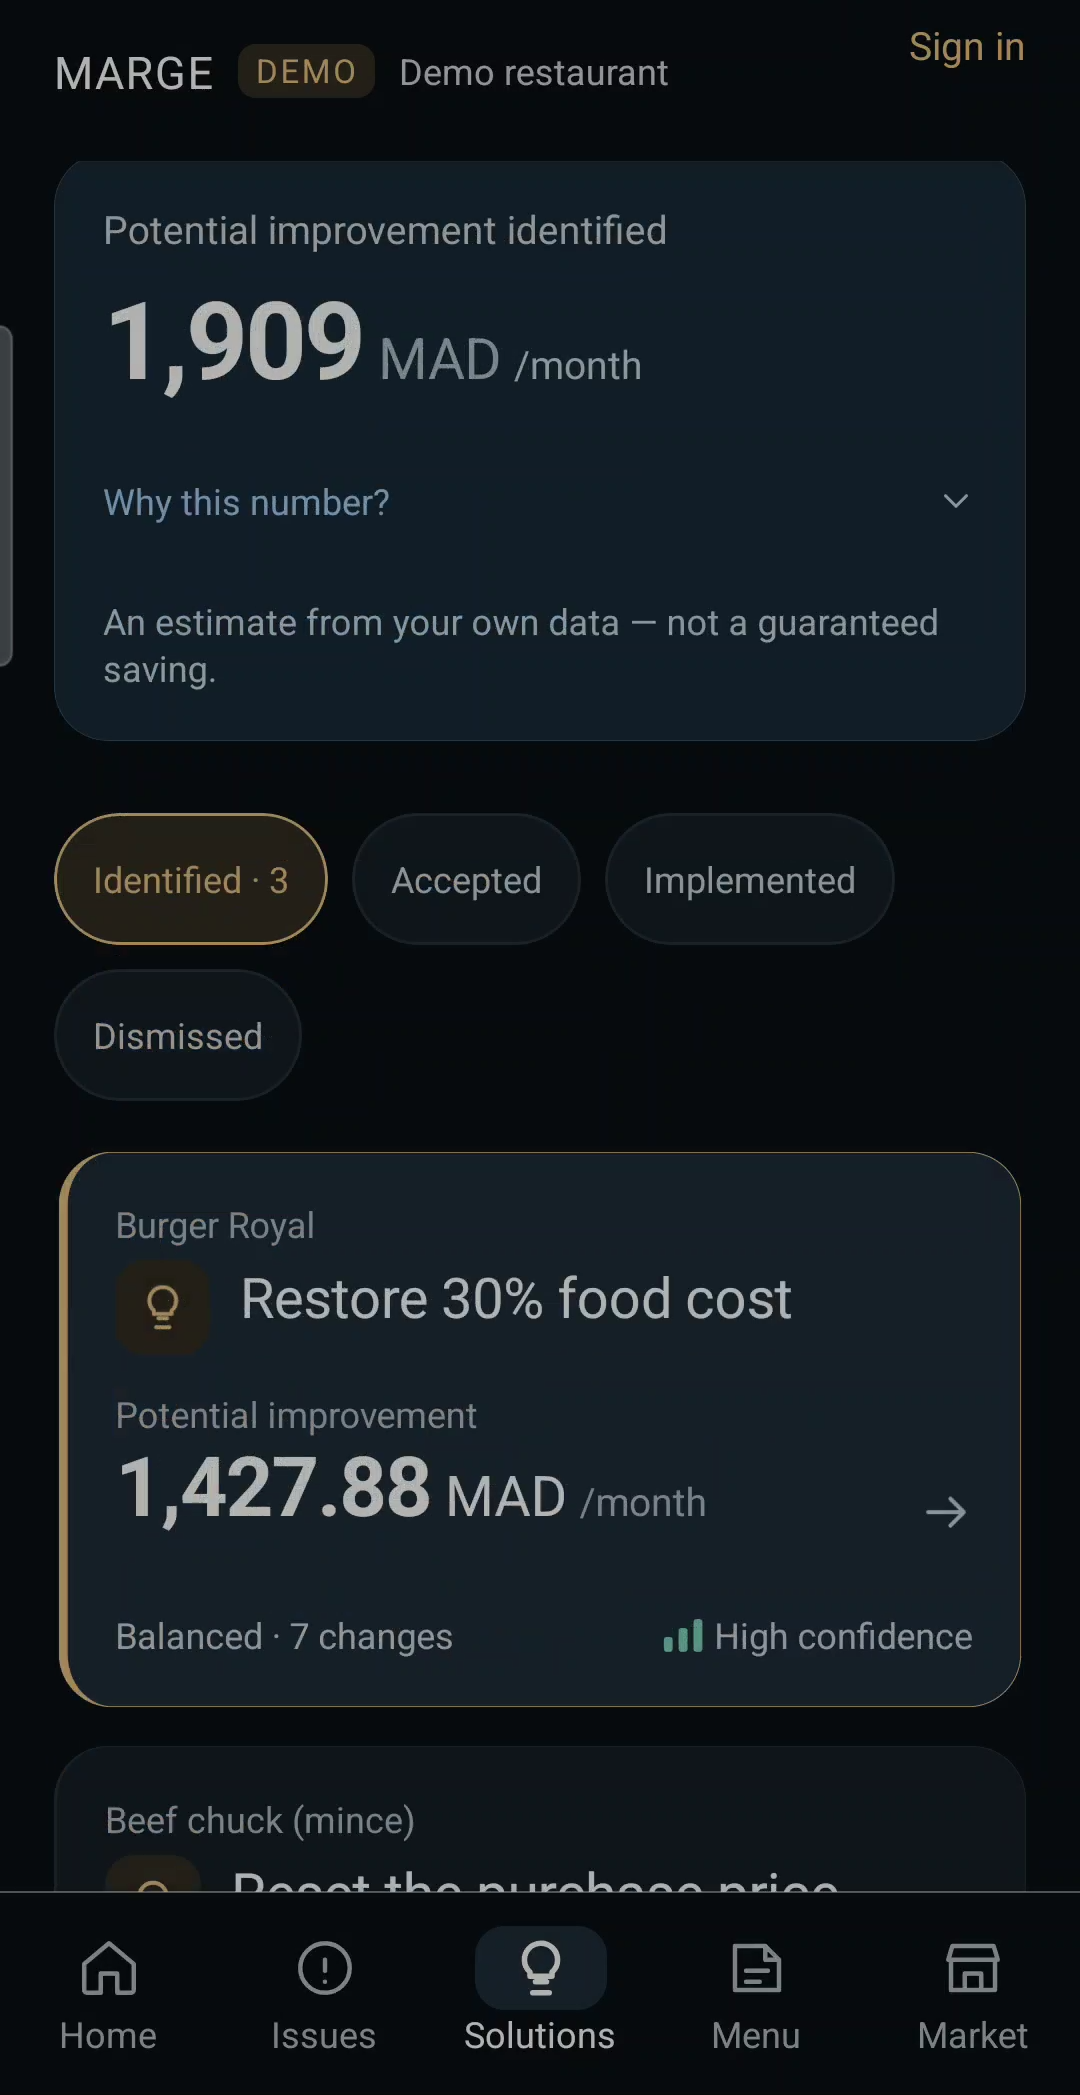
Options with their estimated effect
Your call
The owner decides.
Accept a plan, set it aside or come back later. Nothing changes until you act, and an accepted plan is never counted as money saved.
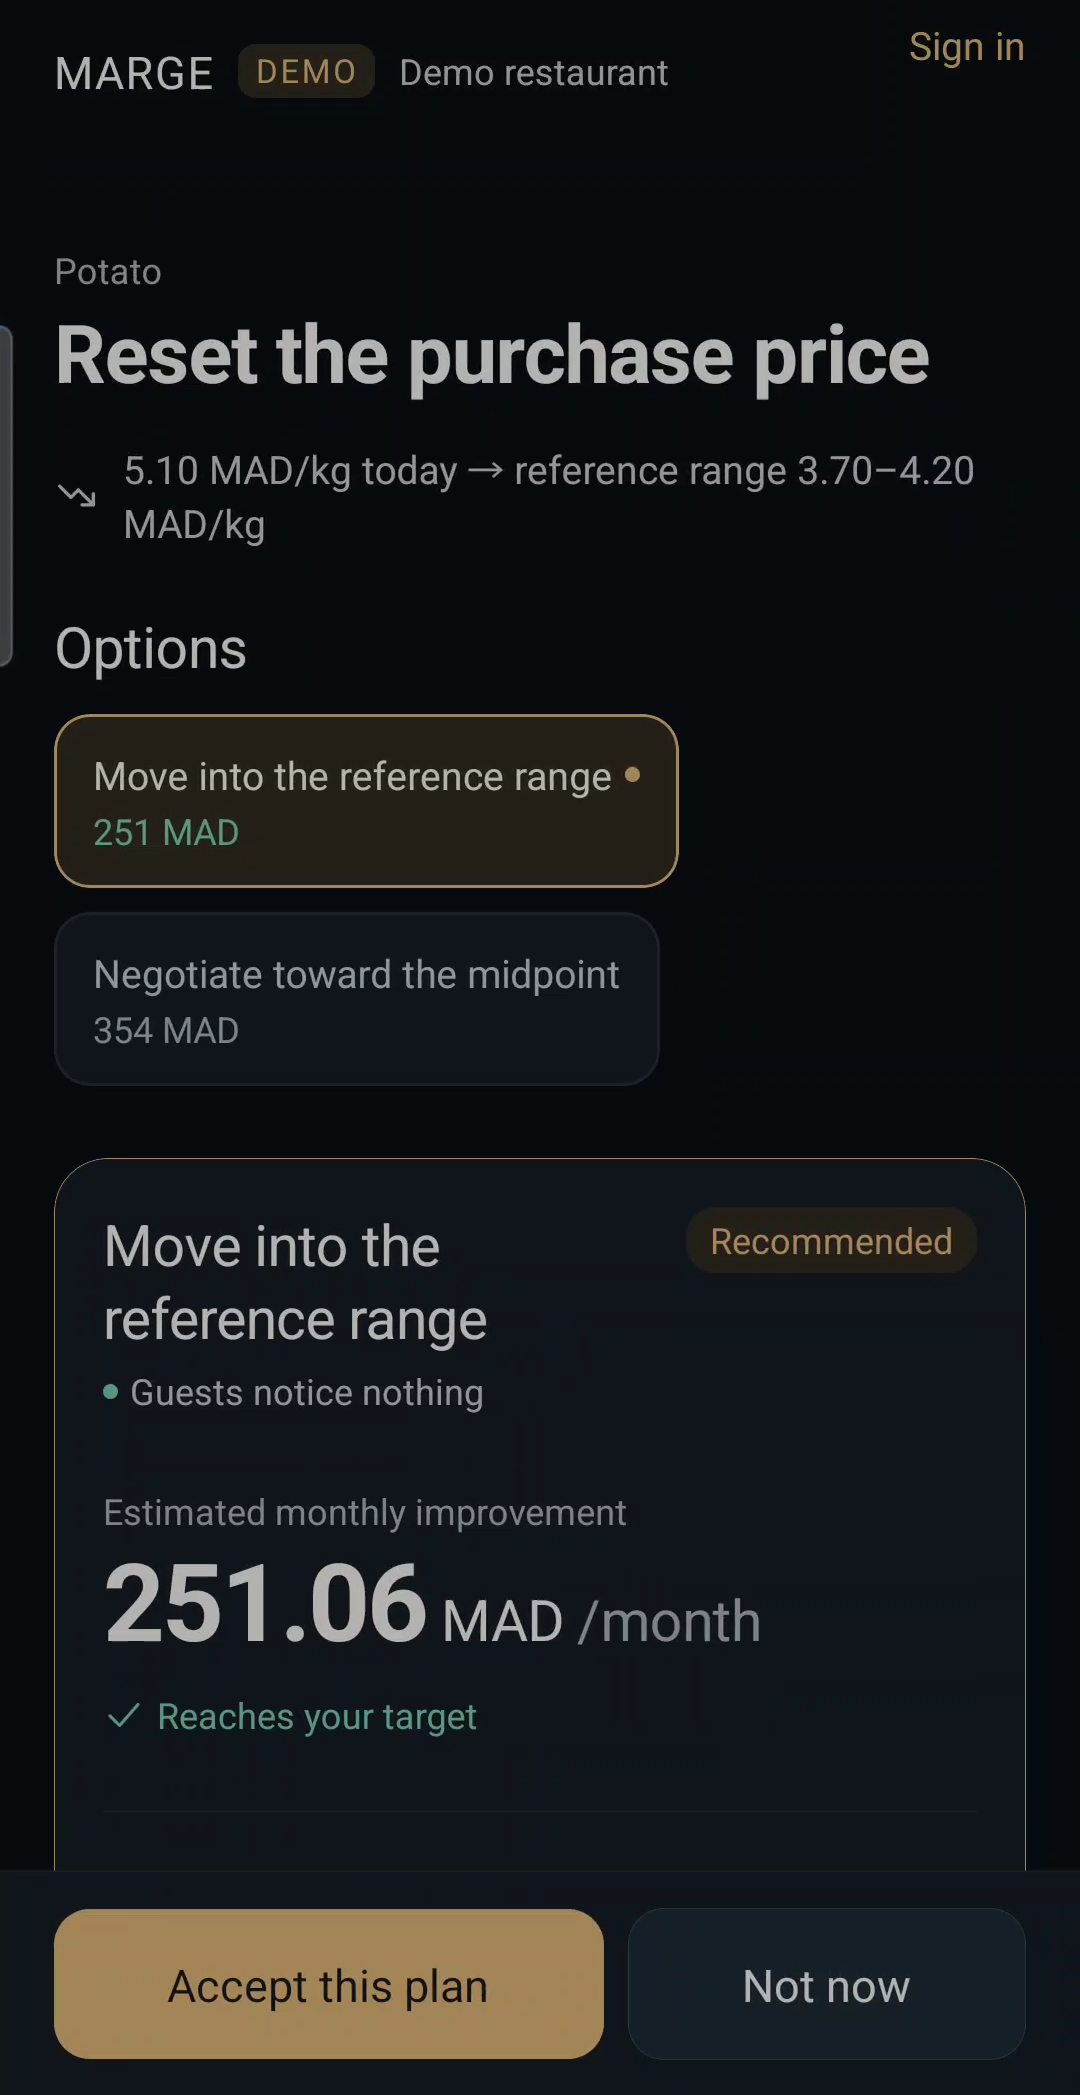
Accept · Not now
Every leak gets a ticket.
Pull a ticket off the rail. Each one shows what happened, why it was flagged, the evidence behind it and the options. The call is yours.
Supplier price
Beef chuck (mince)
+12.5% in 90 days
1,455.95 MAD / month
MediumWhy it was flagged
The purchase price moved from 80.00 to 90.00 MAD/kg over 90 days. That is above the 8% alert threshold the owner set, and beef is a large share of purchasing.
The evidence
| Current price | 90.00 MAD/kg |
|---|---|
| 30 days ago | 86.00 MAD/kg |
| 90 days ago | 80.00 MAD/kg |
| Monthly volume | 145.59 kg |
| Menu items affected | 4 |
Options to consider
- Check for a genuine wholesale price movement
- Check delivery terms and minimum order size
- Check the quality or specification delivered
MARGE suggests. You decide.
Nothing happens on its own
MARGE never changes a price, a recipe or a supplier. It shows the finding and the options; you choose.
Accepted isn’t saved
An accepted plan is tracked as planned, not as savings. Compare your own results once you’ve acted.
It says when it doesn’t know
Where data is limited, MARGE says so and lowers its confidence instead of inventing a number.
Every kitchen has a rail.
- RestaurantsRecipe costs, menu prices, supplier increases and portions.
- Cafés & coffee shopsMilk and beans per cup, waste at close, supplier prices.
- Bakeries & pastry shopsButter, flour and chocolate prices, product costs, losses.
- Fast foodPortion consistency, high-volume margins, purchasing.
- Other food serviceIf you buy ingredients and sell what you make, MARGE can read it.
Straight answers.
Is MARGE a POS or till system?
No. MARGE works alongside the till, POS and suppliers you already have. It reads the information they produce; it doesn’t replace them.
How reliable are the figures?
Every amount comes from your own data and can be traced back to it. Each finding shows a confidence level that reflects how complete the data is. Estimates are not guaranteed savings.
Will MARGE change my prices or suppliers?
Never. MARGE shows what it found, why it matters and the options worth considering. You decide what to do. Nothing is applied automatically.
How does the free first month work?
Send the short request form. Our team reviews it, contacts you and arranges guided onboarding. The first month is free for eligible food-service businesses.
First month free.
Every eligible food-service business can request its first month free. Send a short request; our team reviews it, contacts you and guides your onboarding with your own data.
MARGE onboards a limited number of businesses at a time, so each one gets a guided start.